

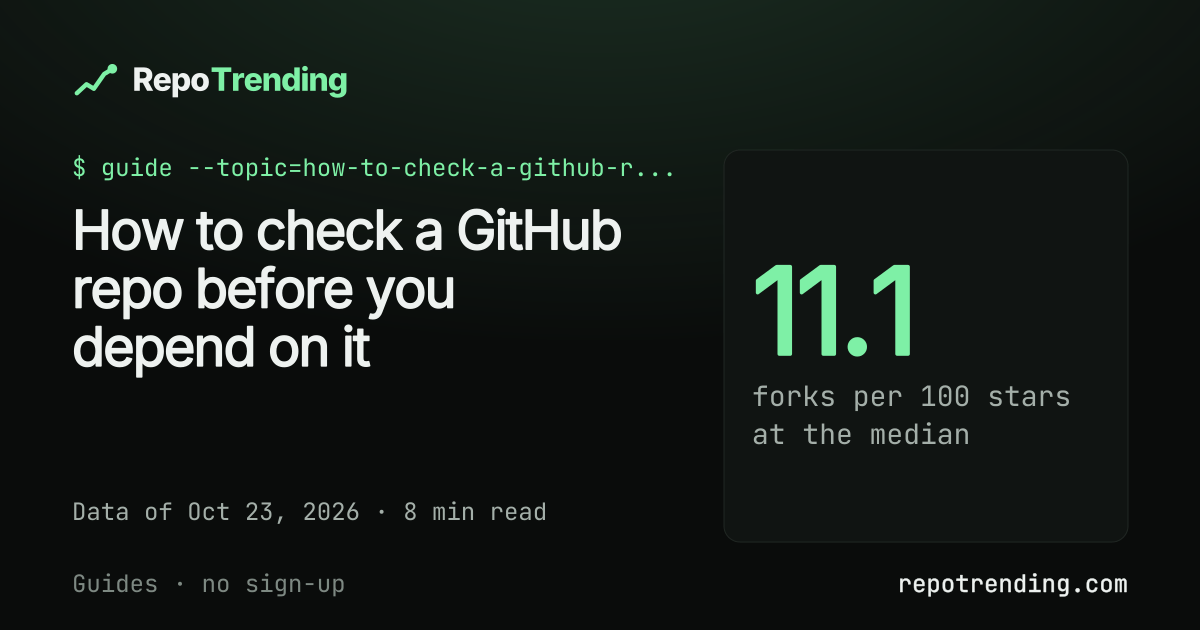
Check five things before you depend on a GitHub repo: its license, how its forks compare with its stars, whether anyone committed recently, how old it is, and what its open issues say. We hold numbers for three of those, so you can see what is typical; the other two you read on GitHub.
On Oct 23, 2026, the typical repo among the 2,500 that have a page on RepoTrending has 11.1 forks for every 100 stars, and 212 of the 2,500 show no license. This guide is for a developer about to add a library, a tool or a template to a project. It gives the benchmark for each check and says plainly what we can’t see. It is not legal or security advice.
What should you check before you depend on a repo?
Run the checks in this order and stop at the first one that fails, because a missing license ends the question before any other number matters.
Everything below that has a count is about the 2,500 repos with a page on Oct 23, the most starred of the 12,468 we track, not about GitHub as a whole. What 12,468 GitHub repos look like explains how that list is built. For a five-minute version aimed at AI coding tools, see how to find Claude Code repos worth trying.
Does the repo have a license?
If GitHub shows no license, the default is that you may not reuse the code. GitHub’s own page, “Licensing a repository”, says that without a license “the default copyright laws apply, meaning that you retain all rights to your source code”. 212 of the 2,500 repos show no license on Oct 23, and the list includes repos with more than 180,000 stars.
MIT is the most common label (953 repos), then Apache-2.0 (489). Open source licenses on popular GitHub repos has the full counts. If the license is present, read it; the label is not the text.
Do the forks match the stars?
Compare the fork count with the star count, and then ask why they differ. GitHub’s page on forks says they are “repositories that start as copies of another repository”, so a high ratio means many people copied the repo, and a low one means most stars never turned into a copy.
| Forks per 100 stars | Value, of 2,500 repos |
|---|---|
| Median | 11.1 |
| One repo in ten is below | 4.9 |
| One repo in ten is above | 25.0 |
- 11.1forks per 100 starsthe median repo
- 4.9forks per 100 starsone repo in ten is below
- 25.0forks per 100 starsone repo in ten is above
- 212repos with no license
The ratio depends on the language, so compare a repo with others written in the same one. Java has the highest median of the languages with 60 repos or more on the list, and Rust the lowest.
| Language | Median forks per 100 stars | Repos |
|---|---|---|
| Java | 24.3 | 103 |
| Jupyter Notebook | 16.8 | 63 |
| C++ | 12.6 | 115 |
| C | 12.0 | 70 |
| Python | 11.8 | 488 |
| JavaScript | 10.6 | 285 |
| TypeScript | 10.1 | 417 |
| Go | 9.1 | 198 |
| Rust | 6.5 | 157 |
The extremes are not a quality score. The five repos with the highest ratio are github/docs (69,202 forks on 21,079 stars), Pierian-Data/Complete-Python-3-Bootcamp, k1tbyte/Wand-Enhancer, qmk/qmk_firmware and firstcontributions/first-contributions. Their descriptions say they are the source of docs.github.com, course files for a Udemy course, an extension for an app, keyboard firmware and a practice repo for first contributions. People fork those to work with them. We haven’t tested whether a high or low ratio predicts anything about maintenance, so use it as a prompt to open a few forks and see whether anyone changed the code.
| Repo | Stars | Forks | Forks per 100 stars |
|---|---|---|---|
| github/docs | 21,079 | 69,202 | 328.3 |
| Pierian-Data/Complete-Python-3-Bootcamp | 29,817 | 87,109 | 292.1 |
| k1tbyte/Wand-Enhancer | 32,708 | 84,477 | 258.3 |
| qmk/qmk_firmware | 20,778 | 44,390 | 213.6 |
| firstcontributions/first-contributions | 56,473 | 111,414 | 197.3 |
At the other end, astral-sh/ty, a Python type checker, has 19,913 stars and 342 forks, which is 1.7 forks per 100 stars. A tool people install and run rather than copy sits low without anything being wrong. You can open github/docs or tensorflow/tensorflow (201,189 stars, 79,381 forks, 39.5 per 100) to see the numbers we hold for a repo.
Is anyone still working on it?
Open the commit history and GitHub’s Pulse page, because we don’t collect either. GitHub describes Pulse, under the Insights tab, as an overview that lists open and merged pull requests and open and closed issues, with a graph of commit activity. By default it shows the last seven days, and the Period menu changes that.
For a library you plan to keep for years, a repo with no commit in the last year deserves a question to the owner, whatever its stars say. We don’t have a benchmark for that, so we won’t give one.
How old is the repo, and how fast did it collect stars?
Compare the creation date with the star total. The 2,500 repos range from 2008 to 2026: 190 were created in 2023, 143 in 2024, 160 in 2025 and 175 in 2026. A repo made this year with 30,000 stars collected them in months, and one made in 2014 took years. Stars per year: comparing old and new GitHub repos shows how to put them on one scale and where that breaks.
A total can’t show whether a repo is moving now. That is what stars gained is for, and stars gained vs total stars compares the two. Our first gains arrive Oct 24 for the day, Oct 30 for the week and Nov 22 for the month.
What do the description and topics tell you?
Little, but they are quick to read. 19 of the 2,500 repos have no description, and 433 have no topics. The median repo lists 7 topics. A repo with neither is not a bad repo, but you will have to read its README to learn what it does.
What does this sample hide?
It hides every repo outside the 2,500, and it can’t see what happens inside a repo. We take every public repo with 5,000 or more stars plus recent ones above a star floor, and only the 2,500 most starred get a page, so a small library with a handful of users is not here. The lowest star count on the list is 18,279. How we rank lists the full method.
We don’t check for bought or farmed stars yet, so the star counts in this guide show what GitHub displays and nothing more. The fork and star counts are as the GitHub REST API reported them on Oct 23, and they change daily.
Frequently asked questions
What should I check before using a GitHub repo as a dependency?
Check five things: the license, how the forks compare with the stars, recent activity, the age of the repo, and its open issues and releases. We hold numbers for the first, second and fourth; you read the rest on GitHub.
How many forks should a popular GitHub repo have?
There is no right number. Among the 2,500 repos we track, the median is 11.1 forks per 100 stars on Oct 23, 2026, and about one repo in ten is under 4.9 or over 25.0. It differs by language, from 6.5 for Rust to 24.3 for Java.
Does a lot of stars mean a repo is safe to depend on?
No. A star is a bookmark. It says nothing about recent commits, maintenance or license. We don’t check for bought or farmed stars yet, so treat the count as a reason to look, not as proof.
Can RepoTrending tell me whether a repo is still maintained?
Not yet. We save one star count per repo per day and don’t collect commits, releases or issues. Open the repo’s commit history and the Pulse page under Insights to see recent activity.
Where to look next
- The all-time list: the most starred repos, each with a page that shows its stars, forks, license and topics.
- AI agent repos: the 165 repos under
ai-agents,mcpandcoding-agents. - How we rank: how the 12,468 repos are found and how star gains will be counted.
Data used
Source for every row: RepoTrending, GitHub REST API (public repository search, read-only), snapshot of Oct 23, 2026 (collector export repos.json, run of 2026-10-23), counted by RepoTrending. Quotes come from GitHub’s documentation pages “Licensing a repository”, “Forks” and “Using Pulse to view a summary of repository activity” (docs.github.com), read Oct 24, 2026.
| Number | Source | Date |
|---|---|---|
| 12,468 repos tracked; 2,500 repos with a page; lowest star count 18,279 | RepoTrending meta.json, repos.json and collector (PUBLISH_LIMIT) |
Oct 23, 2026 |
| 212 repos with no license; MIT 953; Apache-2.0 489 | RepoTrending repos.json |
Oct 23, 2026 |
| Forks per 100 stars (forks divided by stars, times 100): median 11.1; the value at the 10th percentile 4.9; at the 90th percentile 25.0 | RepoTrending repos.json |
Oct 23, 2026 |
| Median forks per 100 stars by language (languages with 60 repos or more, “Other” left out) and repo counts: Java 24.3 (103), Jupyter Notebook 16.8 (63), C++ 12.6 (115), C 12.0 (70), Python 11.8 (488), JavaScript 10.6 (285), TypeScript 10.1 (417), Go 9.1 (198), Rust 6.5 (157) | RepoTrending repos.json |
Oct 23, 2026 |
| Highest forks per 100 stars: github/docs 328.3; Pierian-Data/Complete-Python-3-Bootcamp 292.1; k1tbyte/Wand-Enhancer 258.3; qmk/qmk_firmware 213.6; firstcontributions/first-contributions 197.3 | RepoTrending repos.json |
Oct 23, 2026 |
| astral-sh/ty: 19,913 stars, 342 forks, 1.7 per 100; tensorflow/tensorflow: 201,189 stars, 79,381 forks, 39.5 per 100 | RepoTrending repos.json |
Oct 23, 2026 |
| Created in 2023: 190 repos; 2024: 143; 2025: 160; 2026: 175 | RepoTrending repos.json |
Oct 23, 2026 |
| 19 repos with no description; 433 with no topics; median 7 topics per repo | RepoTrending repos.json |
Oct 23, 2026 |
/ai-agents/: 165 repos (topics ai-agents, mcp, coding-agents) |
RepoTrending repos.json |
Oct 23, 2026 |
| First gains: Oct 24 (day), Oct 30 (week), Nov 22 (month) | RepoTrending meta.json (windows) |
Oct 23, 2026 |
| Quotes on licensing, forks and Pulse (re-read on the approval day: “Licensing a repository” default copyright sentence; “About forks” definition; Pulse list of pull requests and issues, commit graph, last seven days by default, Period menu) | GitHub documentation, docs.github.com | Oct 24, 2026 |
More guides
- Stars per year: comparing old and new GitHub repos
- Daily, weekly or monthly: which window to watch?
- Find Claude Code repos worth trying (Oct 2026)
- GitHub trending alternatives: what each one counts
- How does GitHub decide what is trending?
- Open source licenses on popular GitHub repos
- Stars gained vs total stars: which says more?
- Trending badge for your README, and what it says
- What 12,468 GitHub repos look like