

If you want to know whether a project has lasted, look at total stars. If you want to know what people are discovering this week, look at stars gained. If you can only read one number before you depend on a repo, read neither: open the repo and check when it last had a commit.
We’ll be plain about one thing first. On Oct 23, 2026, RepoTrending has one snapshot of star counts and no stars-gained figure for any repo. This guide compares the two measures by how they’re built, uses the totals we do have, and says when the gains arrive.
Which one should you trust more?
Trust total stars to judge a project that has already had time, and trust stars gained to spot one that hasn’t been noticed yet. They answer different questions, so the real mistake is using one to answer the other.
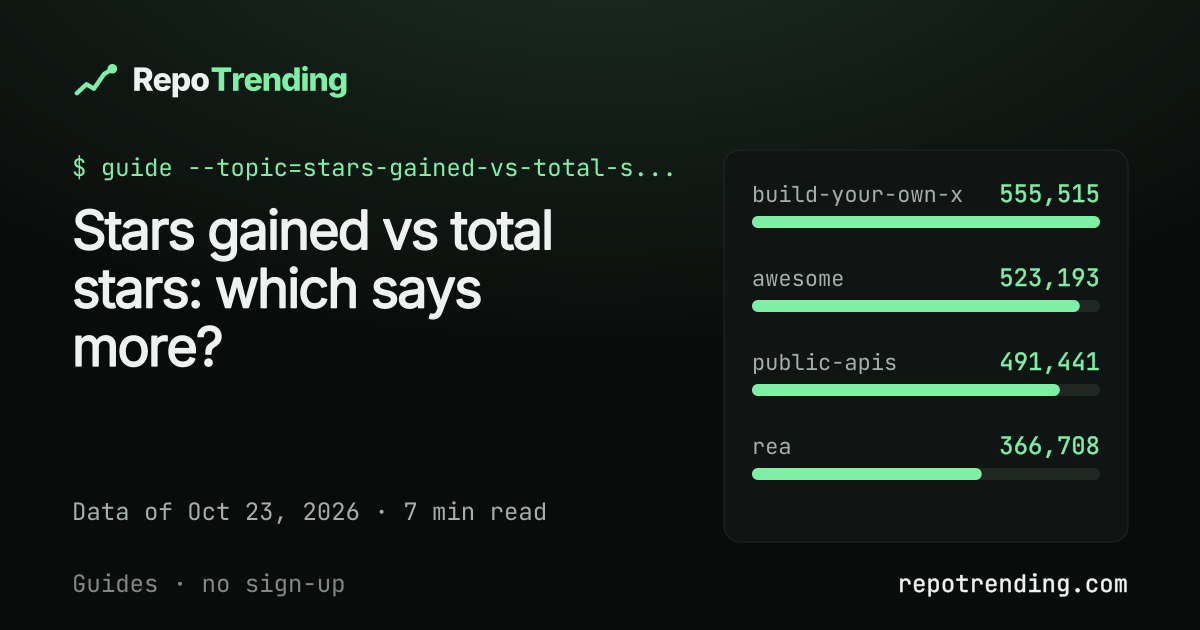
Our own all-time list shows why. On Oct 23 it starts with codecrafters-io/build-your-own-x at 555,515 stars, then sindresorhus/awesome at 523,193 and public-apis/public-apis at 491,441. Those numbers took years to pile up. A single week of gains on any of them would be a rounding error against the total, which is exactly why a total can’t tell you what’s happening now.
| Total stars | Stars gained | |
|---|---|---|
| Answers | What is established? | What is moving now? |
| Window | All time | 24 hours, 7 days or 30 days |
| Weak spot | Rewards age: old repos keep the lead | Can be pushed by a burst of bought stars |
| Best for | Judging whether a project has lasted | Finding repos before they are everywhere |
| On RepoTrending today | Available for all repos | First daily figures Oct 24 |
What do total stars tell you?
Total stars tell you how much attention a repo has collected since it was created, and nothing about when. A total does not say when the stars came: morluto/rea has 366,708, and the number alone cannot show how many arrived this week.
The totals are still useful as a floor for trust. Among the 2,500 repos that have a page on our site, the lowest has 18,279 stars, the median is 29,751 and 135 have more than 100,000. Those 2,500 are the most starred of the 12,468 repos we track, so this is a picture of the top of the pile, not of GitHub. If a repo is in that group, a lot of people have at least bookmarked it.
- 18,279stars at the bottom of the listthe lowest of the 2,500
- 29,751median stars
- 135repos above 100,000 stars
- 175repos created in 2026the fewest stars among them: 18,572
Totals do get you one surprising result: age doesn’t fully decide them. 175 of those 2,500 repos were created in 2026, and the least-starred of them has 18,572 stars. morluto/rea, created Apr 14, 2026, has 366,708 stars on our Claude Code page. That is a total, and it can’t tell you how the count grew over those six months. That is what a gain would show.
What do stars gained tell you?
Stars gained tell you which repos are being discovered in a given window, whatever their size. It is the better signal for “what should I look at this week”, and a worse one for “can I rely on this”.
Here is how we make it. We save one star count per repo per day, in UTC. The gain is the latest count minus the count N days earlier, where N is 1, 7 or 30. It’s net of unstars, so it can be lower than the number of new stars. “Today” means the last 24 hours, not a calendar day. If a snapshot lands at an odd hour, we read the usual hour by a straight line between the two real snapshots on either side, never beyond them, and if that’s impossible the window waits. We never fill a gap with a guess.
The schedule follows from that. The first daily gains appear Oct 24, the first weekly ones Oct 30 and the first monthly ones Nov 22. Until then our this-week ranking shows what it has, marked partial. Ties go to the repo with more total stars.
Where does each measure mislead you?
- Total stars: old repos keep the lead. Four of our 2,500 were created in 2008 and still make the list. A newer repo won’t catch up soon on this measure.
- Stars gained: a spike can be a launch, a mention in a popular newsletter, or bought stars. We don’t check for bought or farmed stars yet, so a big jump on a young repo needs a second look at the repo itself.
- Our coverage: the search we use can’t sort by growth. We find repos with 5,000 or more stars, plus recent and topic-based ones, so a quiet repo under 5,000 stars that suddenly takes off can be missed.
- Our pages: only 2,500 of 12,468 tracked repos get a page. Once gains exist, the biggest gainers of each window come first, so some repos with a smaller total will appear and some with a larger one won’t.
Who should use which?
Use total stars for a dependency decision and stars gained for finding new repos; pick by what you’re about to do.
- Choose total stars if you’re about to add a dependency and want to know the project has survived years of use. Start with the all-time list, then open the repo and check its last commit and license.
- Choose stars gained if you’re a maintainer of a small repo asking whether a spike is real, or a developer who wants to see new tools before they’re everywhere. From Oct 30, the weekly ranking is the place.
- Use both if you’re hunting inside a niche such as Claude Code. Sort by gains to find candidates, then compare totals to see which are young and which are established.
- Use neither if you need to know whether a repo is any good. Stars measure attention, not quality.
For a worked example, open codecrafters-io/build-your-own-x. Today its page has one data point, because the 30-day star chart fills in over the next days. Check back after Oct 24 and you’ll see the total and the movement side by side.
Frequently asked questions
Are GitHub stars a good measure of quality?
Not by themselves. A star is a bookmark or a thumbs-up, and it says nothing about code quality, maintenance or whether the project fits your problem. Use stars to decide what to look at, then read the repo.
What is the difference between stars gained and total stars?
Total stars is the all-time count on a repo. Stars gained is the change in that count over a window, such as 24 hours or 7 days, so it shows what is moving now instead of what built up over the years.
When will RepoTrending show stars gained?
We took our first snapshot on Oct 23, 2026. The first daily gains appear on Oct 24, the first weekly ones on Oct 30 and the first monthly ones on Nov 22.
Can stars gained be faked?
Yes, and so can total stars. We don’t check for bought or farmed stars yet, so treat a big jump on a young repo with care.
Where to look next
- How we rank: the formula, the windows and what we leave out.
- How GitHub trending works: the same question, from GitHub’s side.
- Daily, weekly or monthly: which window to watch: the three gain windows and what each can miss.
- Best of all time: the totals this guide quotes, in full.
- GitHub trending alternatives: what other tools count.
- Stars per year: comparing old and new GitHub repos: what dividing total stars by age does to the top 100.
Data used
All figures: RepoTrending, GitHub REST API (public repository search, read-only), snapshot of Oct 23, 2026. Counts are of the 2,500 repos that have a page unless stated.
| Number | Source | Date |
|---|---|---|
| 12,468 repos tracked | meta.json: trackedRepos |
Oct 23, 2026 |
| 2,500 repos with a page | PUBLISH_LIMIT, collector/compute.mjs |
Oct 23, 2026 |
| 135 repos above 100,000 stars | repos.json export |
Oct 23, 2026 |
| Median 29,751 stars; lowest 18,279 | repos.json export |
Oct 23, 2026 |
| 555,515 / 523,193 / 491,441 stars (top three) | repos.json export |
Oct 23, 2026 |
| 175 repos created in 2026; fewest stars among them 18,572 | repos.json export |
Oct 23, 2026 |
| 4 repos created in 2008 | repos.json export |
Oct 23, 2026 |
| morluto/rea 366,708 stars, created Apr 14, 2026 | /claude-code/ page data |
Oct 23, 2026 |
5,000-star floor (BIG_FLOOR) |
collector/discover.mjs, /how-we-rank/ |
Oct 23, 2026 |
| Gain windows of 1, 7 and 30 days; net of unstars | src/lib/rank.js, /how-we-rank/ |
Oct 23, 2026 |
| First daily gains Oct 24; weekly Oct 30; monthly Nov 22 | meta.json: windows |
Oct 23, 2026 |
More guides
- How to check a GitHub repo before you depend on it
- Stars per year: comparing old and new GitHub repos
- Daily, weekly or monthly: which window to watch?
- Find Claude Code repos worth trying (Oct 2026)
- GitHub trending alternatives: what each one counts
- How does GitHub decide what is trending?
- Open source licenses on popular GitHub repos
- Trending badge for your README, and what it says
- What 12,468 GitHub repos look like